Breadth Divergences: A Fundamental Indicator for Market Sentiment
Market analysts continually search for significant indicators of impending market direction changes. Among many tools and signals, breadth divergences hold special importance as they can provide insightful clues about potential shifts in market sentiment and direction. Breadth divergences analyze the participation level of stocks or sectors in a market rally or decline, making them valuable indicators for investors and traders alike.
Understanding Breadth Divergences
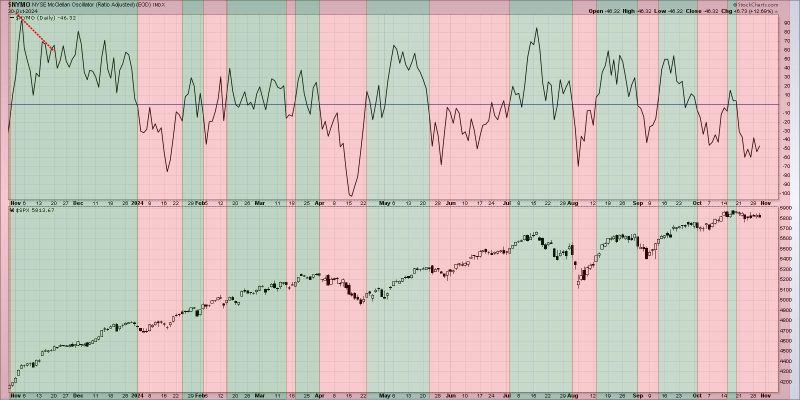
Breadth divergences refer to discrepancies in the number of advancing stocks versus declining stocks within a market index or sector. In a healthy bull market, one would expect the majority of stocks to be trending upwards, indicating broad market participation and strength. However, when a breadth divergence occurs, it suggests that the rally may be losing steam as fewer stocks are participating in the upward movement. This lack of confirmation from a broad range of stocks can signal potential weakness in the market.
Types of Breadth Divergences
There are several types of breadth divergences that analysts commonly monitor. One of the most well-known is the price-advance/decline divergence. In this scenario, the market index continues to trend higher, but the number of advancing stocks decreases, indicating a weakening market breadth. Another type is the new high/new low divergence, where the market index reaches new highs but the number of new highs declines, suggesting a lack of broad market participation in the upward movement.
Interpreting Breadth Divergences
Analyzing breadth divergences requires a nuanced approach and an understanding of market dynamics. While a single breadth divergence may not always signal an imminent market reversal, a series of divergences across multiple indicators and timeframes can provide a more compelling case for a shift in market sentiment. Furthermore, the severity and duration of the divergence can also influence its significance, with prolonged divergences carrying more weight in forecasting potential market downturns.
Using Breadth Divergences in Trading
For traders and investors, incorporating breadth divergences into their analysis can help inform their market decisions and risk management strategies. By monitoring breadth indicators alongside other technical and fundamental factors, traders can better assess the health of the market and adjust their positioning accordingly. Additionally, being aware of potential breadth divergences can provide early warnings of changing market conditions, allowing traders to protect their portfolios and capitalize on emerging opportunities.
In conclusion, breadth divergences serve as valuable indicators for assessing market sentiment and direction. By analyzing the participation levels of stocks or sectors in a market rally or decline, investors and traders can gain deeper insights into market dynamics and potential shifts in sentiment. While breadth divergences are just one piece of the puzzle in market analysis, incorporating them into a comprehensive trading strategy can help traders navigate the complexities of the financial markets more effectively.


