The MACD Histogram: A Powerful Tool for Anticipating Trend Changes
Understanding and predicting market trends is a crucial aspect of successful trading. Traders and investors are constantly looking for tools and indicators that can help them anticipate trend changes and make informed decisions. One such tool that has gained popularity in the world of technical analysis is the MACD Histogram.
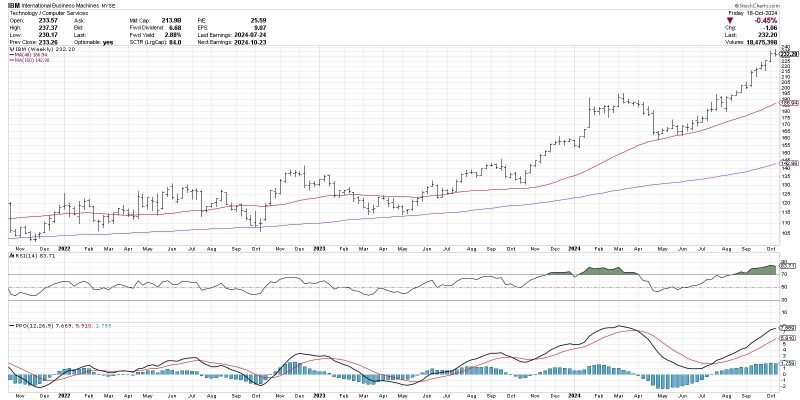
The MACD (Moving Average Convergence Divergence) Histogram is a variation of the MACD indicator, which is widely used to identify changes in a security’s price direction. The MACD Histogram provides a visual representation of the difference between the MACD line and the signal line. By plotting this difference as a histogram, traders can quickly assess the momentum of a trend and anticipate potential reversals.
One of the primary advantages of using the MACD Histogram is its ability to provide early signals of trend changes. When the histogram crosses above the zero line, it indicates that the MACD line is moving above the signal line, signaling a bullish trend. Conversely, when the histogram crosses below the zero line, it suggests that the MACD line is below the signal line, signaling a bearish trend. These crossovers can help traders identify potential entry and exit points in the market.
Moreover, the slope of the MACD Histogram can also provide valuable information about the strength of a trend. A rising histogram suggests increasing momentum in the trend, while a falling histogram indicates weakening momentum. By monitoring the slope of the histogram, traders can gauge the sustainability of a trend and adjust their trading strategies accordingly.
In addition to detecting trend changes, the MACD Histogram can also be used to confirm the validity of a trend. When the price of a security is making new highs or lows, but the MACD Histogram fails to confirm these moves, it may be a sign of a potential trend reversal. This divergence between price action and the MACD Histogram can serve as a warning signal for traders to exercise caution and be prepared for a possible trend change.
While the MACD Histogram is a powerful tool for anticipating trend changes, it is essential for traders to use it in conjunction with other technical indicators and analysis methods. No single indicator can provide foolproof signals, and relying solely on the MACD Histogram may lead to false or late signals. Therefore, traders should consider using a combination of indicators to validate their trading decisions and increase their chances of success in the market.
In conclusion, the MACD Histogram is a valuable tool for traders and investors who are looking to anticipate trend changes and make informed trading decisions. By monitoring the crossovers, slope, and divergence of the histogram, traders can gain valuable insights into the dynamics of a trend and adjust their strategies accordingly. While the MACD Histogram is not a crystal ball for predicting market movements, it can certainly help traders navigate the complexities of the financial markets with more confidence and precision.


