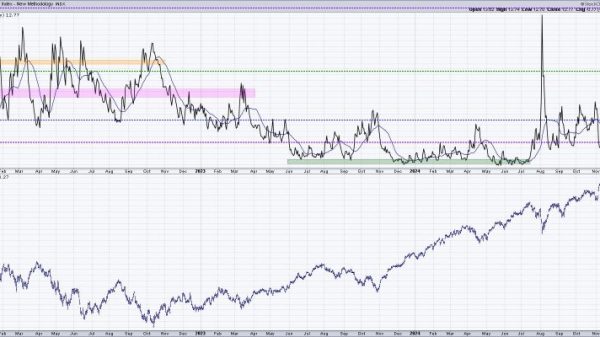
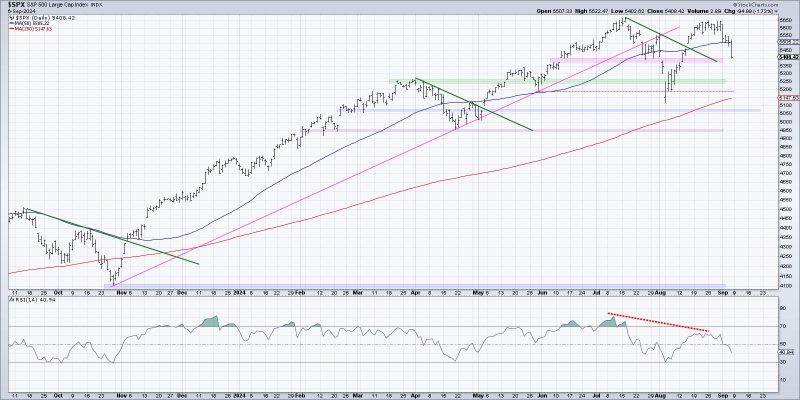
In the world of finance, the term market top is often used to describe a point in time when an asset or market index reaches its peak, signaling a potential downturn or correction. Investors and analysts closely monitor various indicators and charts to spot these potential market tops and make informed decisions about their investments. In this article, we will explore three key charts that are often used as signals of a screaming market top.
Chart 1: Stock Market Valuation Metrics
One of the most common indicators of a market top is the valuation of the stock market itself. Metrics such as the price-to-earnings (P/E) ratio, cyclically adjusted price-to-earnings (CAPE) ratio, and market capitalization-to-GDP ratio are commonly used to assess whether the market is overvalued. When these metrics reach historically high levels, it may signal that stock prices have become disconnected from underlying fundamentals, indicating a potential market top.
In recent years, we have seen several instances where these valuation metrics have reached extreme levels, such as during the dot-com bubble of the early 2000s and the housing bubble of the mid-2000s. Investors who pay attention to these indicators can use them to help determine when it may be time to take a more cautious approach to their investments.
Chart 2: Investor Sentiment Indicators
Another key chart that can provide insights into a potential market top is investor sentiment indicators. These indicators measure the overall mood and sentiment of investors, often through surveys or sentiment indexes. High levels of bullish sentiment, excessive optimism, or widespread complacency among investors can be warning signs that the market may be reaching a top.
Contrarian investors often look for opportunities to go against the crowd when sentiment indicators are showing extreme readings. By being aware of these indicators and using them as a contrarian signal, investors can potentially position themselves to take advantage of market reversals or corrections that may follow periods of extreme optimism.
Chart 3: Market Breadth and Volume
Market breadth and trading volume are also important indicators to watch for signs of a potential market top. Market breadth measures the number of stocks participating in a market rally, while trading volume reflects the level of investor participation and interest in the market. In a healthy and sustainable bull market, rising prices should be supported by broad participation and increasing volume.
However, when market breadth narrows, and trading volume declines as prices continue to rise, it may signal that the market’s strength is waning and a potential top may be near. Monitoring these indicators can help investors gauge the underlying strength of the market and assess whether the current trend is sustainable or likely to reverse.
In conclusion, monitoring these three key charts – stock market valuation metrics, investor sentiment indicators, and market breadth and volume – can provide valuable insights into the health of the market and potential signs of a screaming market top. By staying informed and vigilant, investors can better navigate market cycles and make more informed decisions about their investments.


