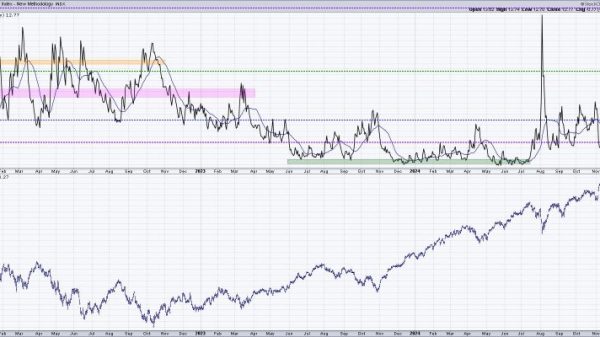
Reversal patterns are critical signals in technical analysis that traders use to identify potential changes in the direction of an asset’s price movement. Successful recognition and interpretation of these patterns can lead to profitable trades, making them an essential tool for traders seeking to maximize their returns. In this article, we will delve into some of the best reversal patterns and explore how traders can utilize them effectively in their trading strategies.
Head and Shoulders Pattern:
The Head and Shoulders pattern is a well-known reversal pattern that can signal a trend reversal from bullish to bearish. This pattern consists of three peaks – a higher peak (head) in the middle, flanked by two lower peaks (shoulders) on either side. The neckline, drawn by connecting the lows between the peaks, acts as a key level of support. A break below the neckline confirms the pattern, indicating a bearish trend reversal.
Double Top and Double Bottom Patterns:
The Double Top and Double Bottom patterns are classic reversal patterns characterized by two peaks or troughs at approximately the same price level. In the Double Top pattern, the price fails to break above the first peak, signaling a reversal to a downtrend. Conversely, in the Double Bottom pattern, the price fails to break below the first trough, indicating a reversal to an uptrend. These patterns are validated when the price breaks below the neckline in the case of a Double Top or above the neckline in the case of a Double Bottom.
Symmetrical Triangle Pattern:
The Symmetrical Triangle pattern is a continuation and reversal pattern that signifies indecision in the market before a significant price movement. This pattern is formed by two converging trendlines, indicating lower highs and higher lows. A breakout above the upper trendline suggests a bullish reversal, while a breakout below the lower trendline indicates a bearish reversal.
Inverted Hammer and Shooting Star Patterns:
The Inverted Hammer and Shooting Star candlestick patterns are powerful reversal signals that appear at the end of an uptrend or downtrend, respectively. The Inverted Hammer has a small body with a long upper wick and little to no lower wick, suggesting potential bullish reversal. On the other hand, the Shooting Star has a small body with a long upper wick and little to no lower wick, indicating a possible bearish reversal. Confirmation of these patterns requires follow-through price action in the opposite direction.
Conclusion:
In conclusion, mastering the art of identifying and interpreting reversal patterns is crucial for traders looking to anticipate trend reversals and capitalize on profitable trading opportunities. By incorporating these patterns into their technical analysis, traders can enhance their decision-making process and improve their overall trading performance. Remember to use these patterns in conjunction with other technical indicators and risk management strategies to maximize your trading success.


