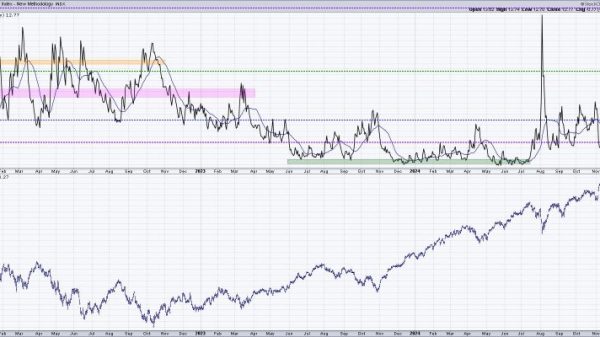
The S&P 500 Index is currently at a critical juncture, as it hovers around its 100-day moving average support. Technical analysts often utilize moving averages to identify potential support and resistance levels, as well as to gauge the overall trend of an asset or index. The 100-day moving average is a key indicator that helps investors assess the intermediate-term trend of the S&P 500.
Moving averages smooth out price data by creating a constantly updated average price over a specific period of time. In the case of the S&P 500, the 100-day moving average is calculated by summing the closing prices of the index over the past 100 trading days and then dividing by 100. This moving average provides a clearer picture of the overall trend compared to single-day price movements, which can be more volatile and subject to short-term fluctuations.
When the S&P 500 is trading above its 100-day moving average, it is generally considered to be in an uptrend, signaling positive momentum in the market. Conversely, when the index drops below this key moving average, it may indicate a potential shift in sentiment towards a downtrend. The 100-day moving average can act as a support level during market pullbacks, helping to cushion downside movements and potentially providing a buying opportunity for investors looking to enter the market.
Technical analysts often use the 100-day moving average in conjunction with other indicators, such as the 200-day moving average or various oscillators, to confirm trend signals and make informed trading decisions. The convergence or divergence of multiple moving averages can offer valuable insights into the strength or weakness of a market trend, aiding investors in identifying potential entry and exit points.
As the S&P 500 teeters on its 100-day moving average support, investors will closely monitor price action to determine whether the index will bounce off this level and resume its uptrend, or if a breach of support could signal a deeper correction in the market. Traders and market participants are advised to exercise caution and conduct thorough analysis before making trading decisions based on moving average signals alone, as market dynamics can be influenced by various factors beyond technical indicators.


