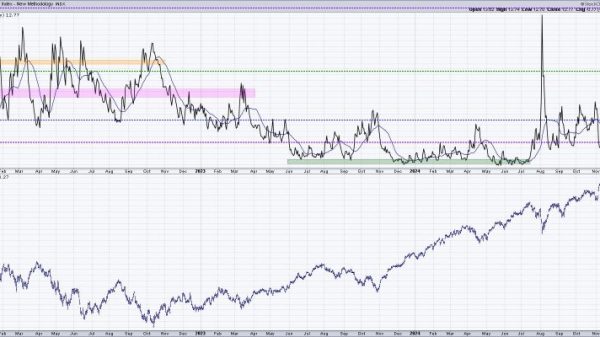
When it comes to analyzing financial markets and making informed decisions, technical indicators play a crucial role. Among these indicators, the Moving Average Convergence Divergence (MACD), Percentage Price Oscillator (PPO), and Price Momentum Oscillator (PMO) are widely used by traders and investors. In this article, we will delve into a showdown between these three popular technical indicators and explore their strengths and weaknesses.
### MACD: Moving Average Convergence Divergence
The MACD is a versatile indicator that consists of two lines – the MACD line and the Signal line. It is calculated by taking the difference between a short-term Exponential Moving Average (EMA) and a long-term EMA. The Signal line is then the EMA of the MACD line. The MACD is used to identify bullish and bearish trends, momentum shifts, and potential buy or sell signals. One of the key advantages of the MACD is its ability to capture both short-term and long-term trends, making it a favorite among traders of all levels.
### PPO: Percentage Price Oscillator
The PPO is a variation of the MACD that compares the difference between two EMAs in percentage terms rather than absolute value. This normalization allows for easier comparison across different securities or timeframes. The PPO is calculated by taking the difference between the short-term EMA and the long-term EMA, dividing it by the long-term EMA, and multiplying by 100. The PPO, like the MACD, helps traders identify trends and potential reversal points. It is particularly useful for traders who prefer percentage-based indicators over absolute values.
### PMO: Price Momentum Oscillator
The PMO is a unique technical indicator that combines price and volume to gauge momentum. It measures the difference between the closing price today and a certain number of days ago, then smooths this value with an EMA. The PMO is plotted as a histogram and a signal line. This indicator is designed to identify overbought and oversold conditions, momentum shifts, and potential trend reversals. The PMO is especially useful for traders who want a more comprehensive view of market momentum that takes into account both price and volume dynamics.
### Which Indicator to Use?
Choosing the right technical indicator depends on your trading style, objectives, and preferences. The MACD is a reliable and widely used indicator that is suitable for trend-following strategies. The PPO, with its percentage-based approach, offers a more normalized view of price movements. Lastly, the PMO provides a unique perspective on momentum that incorporates both price and volume dynamics.
In conclusion, each of these technical indicators has its strengths and weaknesses, and traders should experiment with them to find the ones that best suit their trading strategies. Whether you prefer the traditional approach of the MACD, the normalized view of the PPO, or the comprehensive analysis of the PMO, incorporating these indicators into your trading toolbox can enhance your decision-making process and improve your overall trading performance.


