5 Breadth Indicators That Are Essential for Successful Trading
1. Advance-Decline Line
The Advance-Decline Line is a breadth indicator that measures the number of advancing stocks in an index versus the number of declining stocks. This indicator provides valuable insights into market sentiment and the overall health of the market. A rising Advance-Decline Line indicates broad participation and strength in the market, while a declining line suggests weakness and potential bearishness. By monitoring this indicator, traders can identify early signs of market reversals and make informed trading decisions.
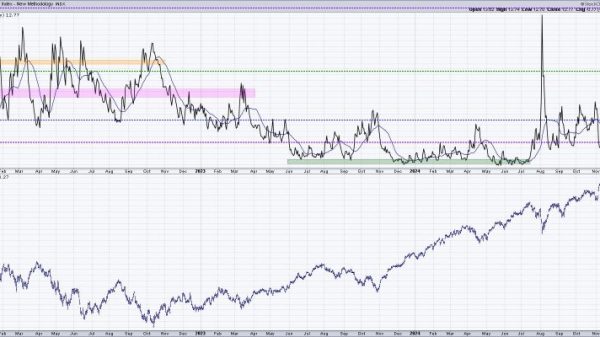
2. New Highs-New Lows Index
The New Highs-New Lows Index measures the number of stocks hitting new highs versus those hitting new lows within a specified period. This indicator helps traders gauge the strength of a market trend and identify potential reversals. When the number of new highs exceeds new lows, it indicates a strong bullish trend, whereas an increase in new lows may signal a weakening market. By tracking this indicator, traders can assess market breadth and make informed decisions based on the prevailing market conditions.
3. McClellan Oscillator
The McClellan Oscillator is a popular breadth indicator that measures market breadth based on the number of advancing and declining issues. It provides valuable insights into the internal strength of the market and helps traders identify overbought or oversold conditions. A positive McClellan Oscillator suggests bullish momentum, while a negative reading indicates bearish sentiment. By analyzing this oscillator, traders can gauge market breadth and anticipate potential market movements.
4. Bullish Percent Index (BPI)
The Bullish Percent Index (BPI) is a breadth indicator that measures the percentage of stocks in a given index that are trading on a point-and-figure buy signal. This indicator helps traders assess market sentiment and identify potential trend reversals. A high BPI reading indicates bullish market sentiment, while a low reading suggests bearishness. By monitoring the BPI, traders can gauge market breadth and make well-informed trading decisions based on the prevailing sentiment.
5. Arms Index (TRIN)
The Arms Index, also known as the TRIN (TRading INdex), is a breadth indicator that measures the ratio of advancing and declining stocks to advancing and declining volume. This indicator helps traders assess market breadth and overall investor sentiment. A TRIN reading above 1 indicates bearish sentiment, while a reading below 1 suggests bullish sentiment. The Arms Index is particularly useful in identifying short-term market extremes and potential trend reversals. By monitoring this indicator, traders can gain valuable insights into market breadth and make timely trading decisions.
In conclusion, breadth indicators play a crucial role in assessing market sentiment, gauging market breadth, and identifying potential trend reversals. By incorporating these breadth indicators into their trading analysis, traders can make informed decisions, manage risks effectively, and improve their overall trading performance. By understanding the significance of these breadth indicators, traders can enhance their trading strategies and achieve greater success in the dynamic and ever-changing financial markets.


