Market breadth is a crucial indicator in assessing the health and direction of financial markets. Defined as the strength and depth of participation in a market, market breadth offers valuable insights into the underlying strength of a trend. While market indices like the S&P 500 and Dow Jones Industrial Average provide a broad overview of market performance, analyzing market breadth can offer a more nuanced perspective.
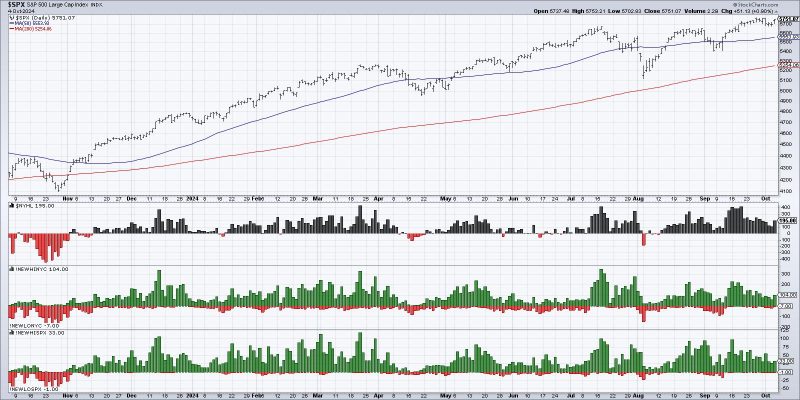
One key measure of market breadth is the advance-decline line, which tracks the number of advancing versus declining stocks in a given market. A strong advance-decline line suggests broad participation in a market rally, indicating widespread strength across various sectors and industries. On the other hand, a weak advance-decline line may indicate that only a few stocks are driving the market higher, raising concerns about the sustainability of the rally.
Another important indicator of market breadth is the number of stocks trading above their 200-day moving average. When a significant number of stocks are trading above this long-term trend line, it suggests that the market is in a healthy uptrend with broad participation. Conversely, a low percentage of stocks above their 200-day moving average could signal a lack of conviction among market participants and a potential reversal in the trend.
Market breadth indicators can also help identify potential market turning points. Divergences between market indices and breadth indicators, such as the percentage of stocks making new highs or lows, can provide early warning signals of a market reversal. For instance, if the market is reaching new highs, but fewer stocks are participating in the rally, it may indicate a weakening market trend and the possibility of a correction.
Moreover, market breadth can offer insights into sector rotation and market leadership. By analyzing the breadth of sector participation in a market rally, investors can identify which sectors are driving the market higher and whether the rally is broad-based or concentrated in a few sectors. Understanding sector rotation can help investors make informed decisions about where to allocate their capital and adjust their portfolios accordingly.
In conclusion, monitoring market breadth is essential for investors seeking a comprehensive understanding of market dynamics. By analyzing advance-decline lines, the percentage of stocks above their 200-day moving average, and other breadth indicators, investors can gauge the strength of market trends, identify potential turning points, and assess sector rotation. Incorporating market breadth analysis into investment strategies can help investors make more informed decisions and navigate changing market conditions with greater confidence.


