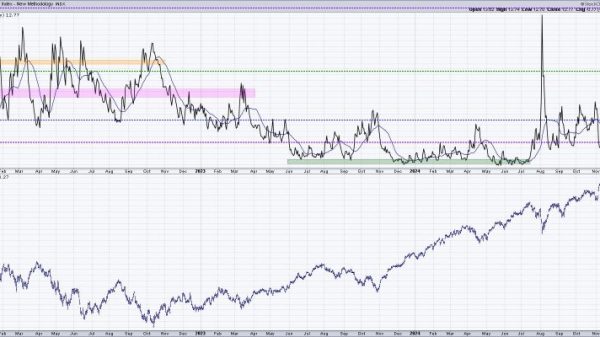
The Relative Strength Index (RSI) is a popular technical indicator used by traders to identify potential entry points in the stock market. By analyzing price movements and momentum, traders can gain insights into when a security may be either overbought or oversold, providing opportunities for profitable trades.
One common strategy for utilizing the RSI is to look for divergence between the indicator and the price chart. Divergence occurs when the price of a security is moving in a different direction than the RSI. For example, if the price of a stock is making new highs, but the RSI is showing lower highs, it could be a sign that the stock is losing momentum and may be due for a pullback.
Another key aspect of using the RSI is identifying overbought and oversold conditions. When the RSI moves above 70, it is considered overbought, indicating that the security may be due for a correction. Conversely, when the RSI drops below 30, it is considered oversold, suggesting that the security may be undervalued and due for a bounce back.
Traders can use these overbought and oversold levels as potential entry points for their trades. For example, if a stock’s RSI reaches above 70 and starts to decline, a trader may consider entering a short position in anticipation of a pullback. On the other hand, if a stock’s RSI falls below 30 and then starts to rise, a trader may see it as a signal to enter a long position.
It is important to note that while the RSI can be a valuable tool for identifying entry points, traders should not rely on it alone. It is always recommended to use other technical indicators, as well as fundamental analysis, to make informed trading decisions.
In conclusion, the Relative Strength Index (RSI) is a powerful tool that can help traders identify potential entry points in the stock market. By understanding how to interpret divergence, overbought and oversold conditions, traders can enhance their trading strategies and increase their chances of successful trades.


